Micro-Interactions Transform Conversion Tracking in Subscription Service Dashboards for Emerging Market Retailers
Elena Krause · Jul 28, 2026
Micro-Interactions Transform Conversion Tracking in Subscription Service Dashboards for Emerging Market Retailers
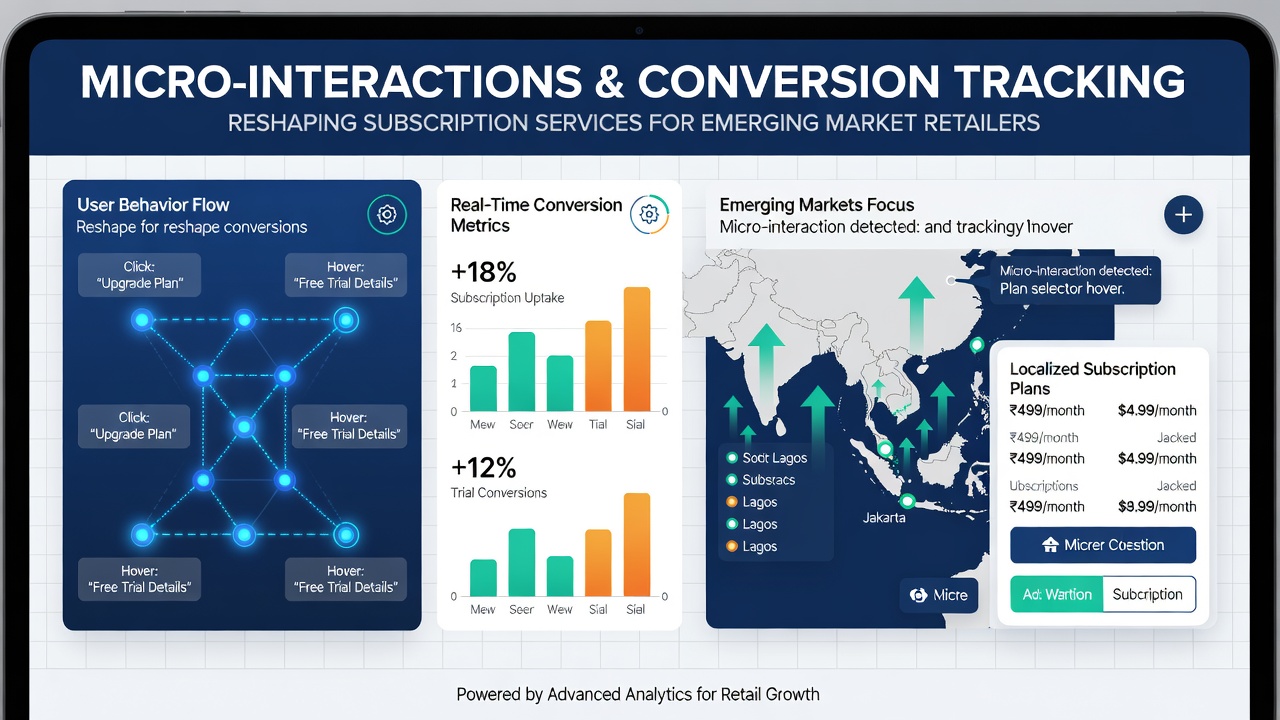
Subscription service dashboards have incorporated micro-interactions such as button hover effects, loading animations, and progress indicators that guide users through checkout flows while capturing granular data points on engagement patterns. These subtle design elements reshape how conversion tracking operates because they record not only final purchases but also intermediate user behaviors like dwell time on pricing tiers and repeated taps on upgrade prompts. Retailers operating in emerging markets have adopted these techniques to refine metrics amid variable network conditions and diverse device types that dominate local consumer bases.
Core Mechanisms Behind Micro-Interactions
Developers embed micro-interactions into subscription interfaces through lightweight code libraries that trigger responses to user actions without adding significant load times. Data shows these elements log events such as partial form completions and hover durations which feed into analytics platforms used by retailers in regions like Southeast Asia and Latin America. According to figures from mobile industry reports, conversion tracking systems now integrate these signals to build more accurate funnels that account for interruptions common in areas with inconsistent connectivity.
Effects on Data Collection Practices
Traditional conversion tracking relied on page views and button clicks alone yet micro-interactions expand the dataset to include sequences of micro-events that precede a subscription renewal or upgrade. Retailers have observed that animated feedback on payment confirmation screens increases recorded completion rates because systems capture the moment users engage with success states. Research indicates this approach yields richer behavioral logs that help platforms distinguish between genuine drop-offs and temporary pauses caused by external factors like payment gateway delays.
Regional Adoption Trends Through Mid-2026
By July 2026 platforms serving retailers across Africa and South Asia had rolled out standardized micro-interaction modules that sync with existing dashboard analytics. These modules track interactions in real time and export structured data to tools that comply with local data regulations while supporting cross-border reporting needs. Observers note that merchants using these updated systems report higher resolution in identifying which subscription tiers attract the most engagement during promotional periods.
Integration With Existing Analytics Frameworks
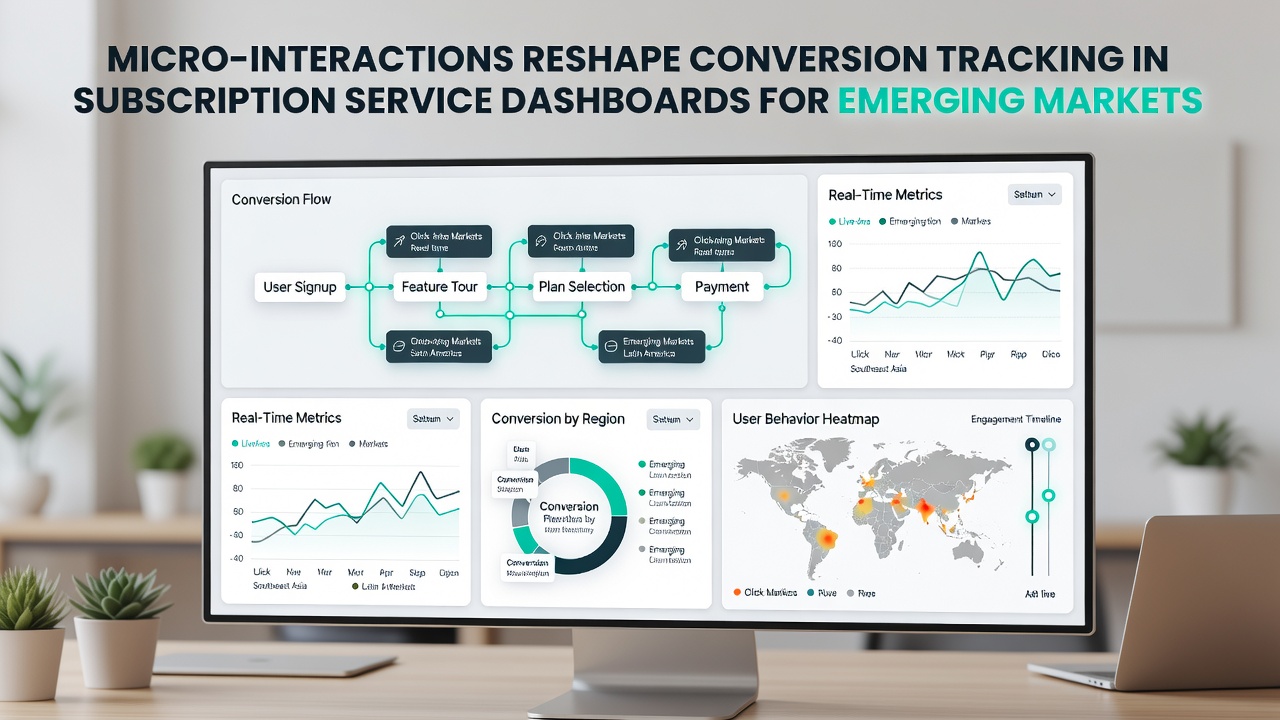
Subscription dashboards connect micro-interaction events to backend systems through APIs that map each animation trigger to specific conversion milestones. This linkage allows retailers to segment user cohorts based on interaction depth rather than solely on final transaction values. Industry reports highlight that such mappings have become standard in platforms targeting small and medium enterprises in emerging economies where mobile-first usage prevails.
Examples From Retail Operations
One retailer in Kenya integrated micro-interactions into its renewal reminders and recorded a measurable uptick in tracked progression through the subscription cycle. Another operation in Brazil applied similar feedback loops to trial-to-paid transitions and gained visibility into hesitation points that previously went unlogged. These cases demonstrate how the technique supplies actionable logs that feed into broader customer retention strategies without requiring extensive infrastructure overhauls.
Technical Considerations for Implementation
Teams building these features prioritize performance by limiting animation complexity to CSS transitions and minimal JavaScript that function across low-bandwidth connections typical in target markets. Data from platform providers reveals that optimized micro-interactions reduce bounce rates in conversion tracking because users receive immediate visual confirmation of their inputs. Retailers have adopted testing protocols that measure both engagement lift and the accuracy of resulting analytics outputs.
Future Outlook for Dashboard Design
Continued refinement of micro-interaction libraries promises further granularity in conversion data as more retailers standardize on these approaches. Studies from academic institutions in Asia have begun examining correlations between specific animation patterns and long-term subscription metrics. Such work supplies evidence that small interface changes accumulate into significant shifts in how success is measured across diverse retail environments.
Conclusion
Micro-interactions continue to expand the scope of conversion tracking by embedding measurable touchpoints throughout subscription journeys. Retailers in emerging markets have integrated these elements into dashboards to capture detailed user paths while maintaining compatibility with regional infrastructure constraints. The resulting data frameworks support more precise evaluation of subscription performance across varied market conditions.