Real-Time Sensor Integration Transforms Responsive Layouts in Interactive Mapping Platforms for Urban Planning Teams
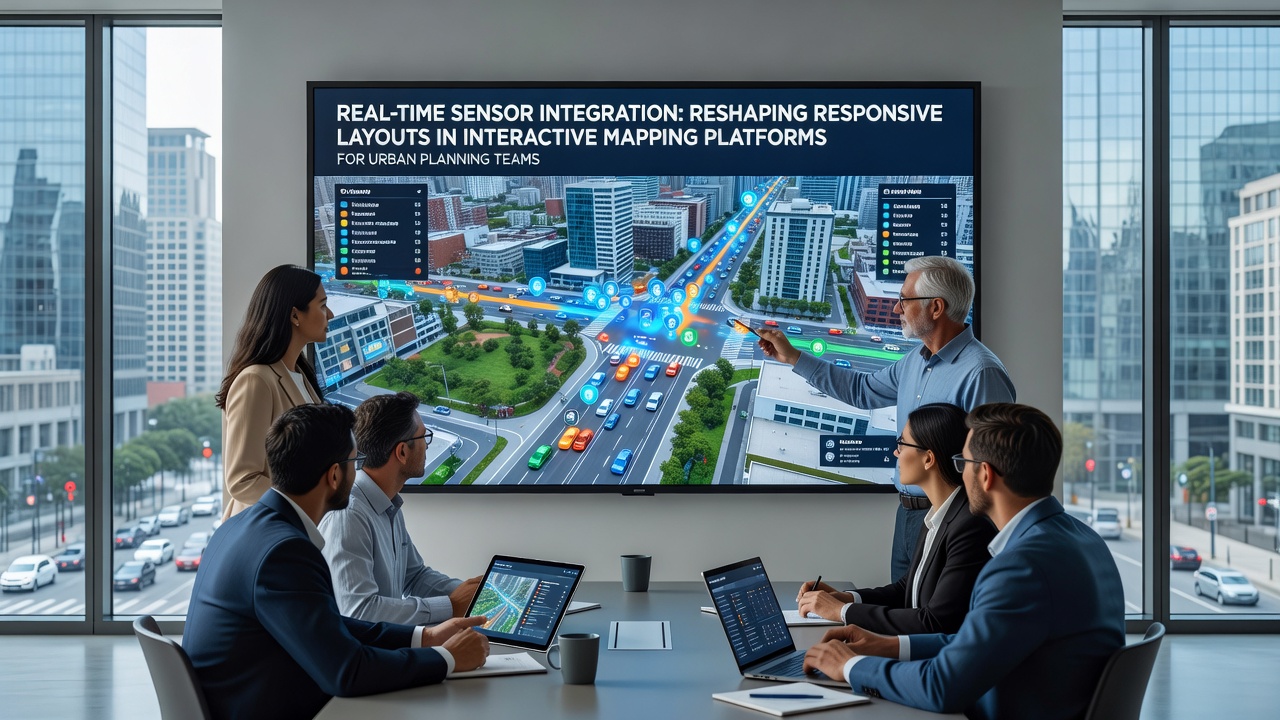
Urban planning teams rely on interactive mapping platforms that now incorporate real-time sensor feeds from traffic monitors, environmental stations, and infrastructure nodes, and these inputs directly influence how layouts adapt across devices and user roles. Data streams arrive continuously from sources such as inductive loop detectors on roadways and particulate matter sensors at intersections, prompting the interface to resize panels, reorder layers, and highlight zones without manual intervention. Observers note that this integration shifts the platform from static visualization tools toward systems that respond to live conditions by rearranging content blocks and adjusting zoom behaviors based on data volume.
Sensor Networks Feeding Dynamic Map Interfaces
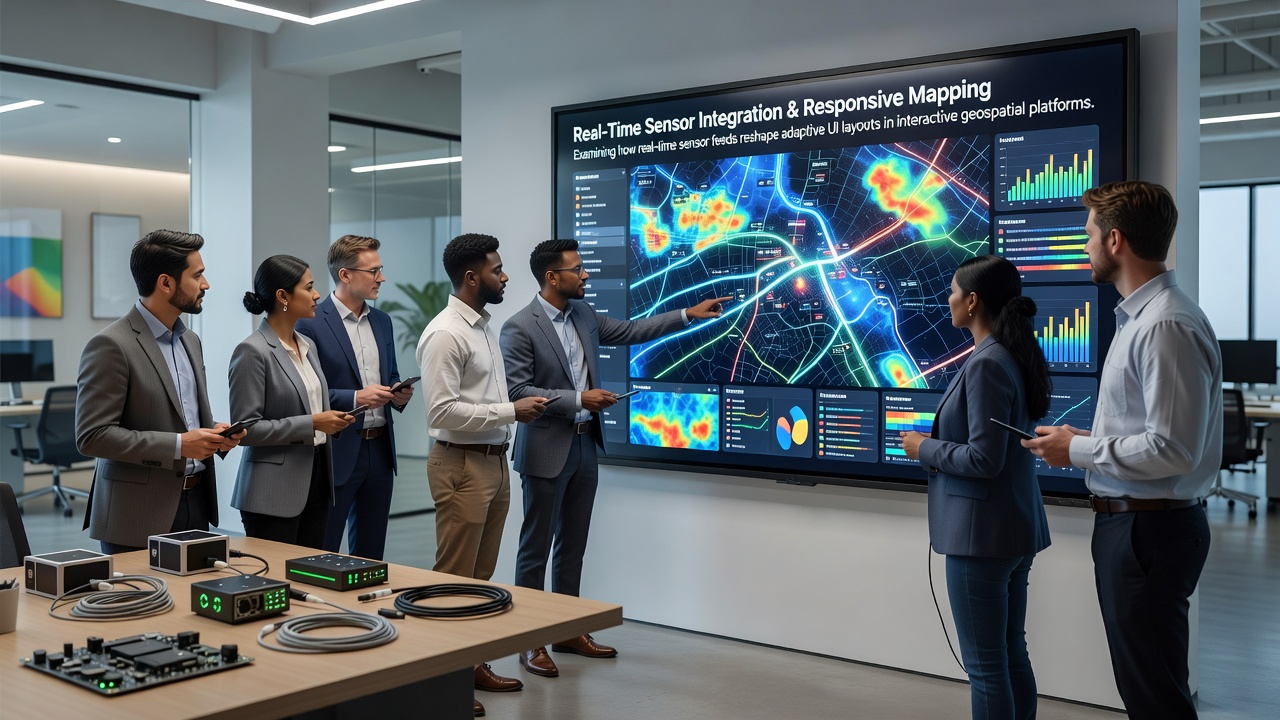
Modern deployments connect arrays of IoT devices that capture vehicle counts, air quality indices, and utility flow rates, while mapping engines process these values to determine which visual elements receive priority on screen. When sensor readings spike in one district, the layout compresses secondary menus and expands the affected geographic area, allowing planners to focus on emerging patterns. Research indicates that platforms achieve this through event-driven rendering pipelines where incoming packets trigger CSS grid recalculations and SVG layer updates, maintaining performance even as multiple data sources converge.
Integration occurs at the data ingestion layer, where protocols such as MQTT route readings into geospatial databases that tag each measurement with precise coordinates and timestamps. The mapping application then queries these tagged records to decide whether a responsive breakpoint activates, shifting from a multi-column desktop view to a stacked mobile arrangement when localized alerts exceed predefined thresholds. Teams working in field offices report that the same dataset renders differently depending on device orientation and connection speed, because the system evaluates both sensor density and network latency before finalizing the layout.
Layout Adaptation Mechanisms in Practice
Responsive behavior extends beyond simple screen-size adjustments to include conditional display of analytical widgets that appear only when relevant sensor thresholds are crossed. For example, a sudden rise in noise levels near a proposed development site causes the interface to surface acoustic modeling tools beside the map while collapsing unrelated demographic charts. Data shows that such conditional rendering reduces cognitive load for planners who must evaluate multiple variables simultaneously during review sessions.
Platform developers implement these changes through component-based architectures that separate map rendering from data orchestration, allowing layout rules to reference live streams without rebuilding the entire view. When a temperature sensor network reports heat-island effects across several blocks, the system automatically promotes thermal imagery layers to the foreground and resizes legend elements to accommodate additional color scales. Studies from academic GIS programs confirm that this approach maintains frame rates above 30 per second even during peak data influx periods.
Applications Across Planning Workflows
City agencies in North America and Europe have adopted these sensor-driven layouts to support infrastructure projects where timing and public safety considerations intersect. Transportation departments integrate vehicle detection sensors with mapping views so that construction sequencing tools expand automatically when congestion metrics climb, giving schedulers immediate visual feedback on route alternatives. Environmental review teams observe similar patterns when water quality sensors along river corridors feed into flood-risk overlays that resize to emphasize vulnerable parcels during storm events.
Collaboration features also evolve under this model, as shared sessions allow multiple users to see layout changes synchronized across their devices whenever new sensor packets arrive. A planner viewing the map on a tablet sees the same data-driven panel expansion that appears on a colleague's workstation, because the adaptation logic resides in the shared state layer rather than individual client settings. Figures from municipal technology reports reveal that adoption of these synchronized responsive features has increased coordination speed during interdepartmental reviews.
Technical Considerations and Standards
Standards bodies such as the Open Geospatial Consortium have published guidelines that address how sensor observation services should expose metadata to mapping clients for layout decisions. These specifications define query parameters that let applications request not only raw values but also recommended visualization priorities, enabling consistent behavior across different software vendors. Implementation teams follow these guidelines when connecting municipal sensor networks to commercial mapping platforms, ensuring that responsive rules remain portable between environments.
Security practices include token-based access controls that limit which sensor streams each user role can trigger for layout changes, preventing unauthorized expansion of sensitive infrastructure layers. As of July 2026, several pilot programs in Australian smart-city initiatives have demonstrated successful deployment of these controls alongside edge-computing nodes that preprocess readings before they reach the central mapping service, thereby lowering latency for responsive updates.
Conclusion
Real-time sensor integration continues to drive measurable changes in how interactive mapping platforms organize content for urban planning teams, with layout adaptations now tied directly to live data conditions rather than static configurations. Continued refinement of data pipelines and rendering engines supports broader adoption across public agencies and consulting firms, while alignment with established geospatial standards helps maintain interoperability. The resulting systems deliver context-aware interfaces that scale from desktop analysis to field inspections without requiring separate application versions.