WebGPU Adoption Patterns Among Developers Building Interactive Scientific Visualization Tools
Rafael Brooks · Jul 25, 2026
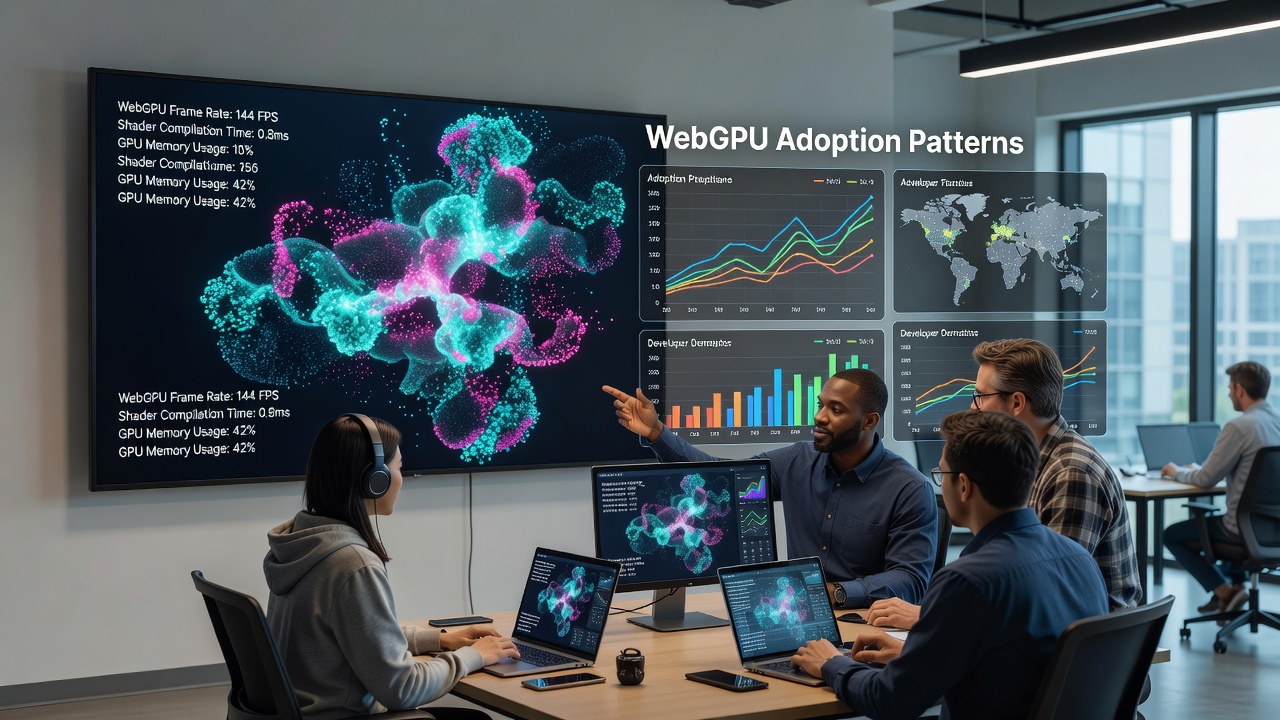
WebGPU Adoption Patterns Among Developers Building Interactive Scientific Visualization Tools
WebGPU has emerged as a key technology for developers creating interactive scientific visualization tools, and adoption patterns show steady integration across academic, government, and private research environments since its stabilization in browser engines. Developers working with complex datasets in fields such as molecular modeling, climate simulation, and astrophysics have shifted from WebGL to WebGPU for its enhanced compute capabilities and direct access to GPU resources, while patterns indicate stronger uptake in projects requiring real-time data manipulation rather than static rendering alone.
Current Landscape of WebGPU in Scientific Tools
Research indicates that by July 2026, multiple open-source libraries supporting scientific visualization had incorporated WebGPU backends, allowing seamless transitions for existing codebases built on WebGL. Data from browser usage telemetry reveals that Chrome and Firefox implementations now handle the majority of WebGPU calls in visualization applications, whereas Safari adoption trails but continues to expand through incremental updates. Those who have tracked repository activity on platforms hosting scientific tools note increased commits referencing WebGPU shaders for tasks like particle system simulations and volumetric rendering, with integration often occurring in stages that prioritize compute shaders over full graphics pipeline replacements.
Patterns among developers further reveal that teams handling large-scale datasets prefer WebGPU when projects demand parallel processing without server offloading, and this preference aligns with hardware trends where consumer GPUs support the necessary extensions. Observers note that European research consortia and North American university labs have led early implementations, citing improved frame rates in interactive dashboards compared to legacy approaches.
Developer Adoption Trends and Usage Patterns
Adoption clusters around specific visualization domains, with molecular dynamics tools showing the highest migration rates because WebGPU enables efficient handling of atomic coordinate updates in browser environments. Climate data platforms follow closely, where developers leverage the API for rendering multi-layered atmospheric models while maintaining interactivity for end users adjusting parameters on the fly. Studies from research institutions across Australia and Canada highlight that developers building these tools often start with hybrid setups, retaining WebGL for compatibility layers while routing new compute workloads to WebGPU, and this stepwise method reduces deployment risks in production environments.
What's interesting is how adoption correlates with team size and project duration, as smaller groups focused on rapid prototyping adopt the technology faster than large enterprises managing legacy code. Figures from developer surveys conducted through academic networks show that familiarity with low-level graphics APIs accelerates the learning curve, and many visualization specialists report completing initial WebGPU ports within weeks rather than months when they possess prior experience with similar standards. External factors such as browser support maturity and available debugging tools also influence rollout timelines, with developers in regions with strong open-source communities advancing implementations more rapidly.

Integration Challenges and Solutions Observed
Developers encounter hurdles related to shader portability across devices, yet many address these through abstraction layers that compile high-level descriptions into WebGPU-specific code. Research papers from institutions in the EU document how teams mitigate memory management differences by adopting explicit resource tracking patterns, and this approach has proven effective in preventing leaks during extended visualization sessions. Government-funded projects in the United States have contributed reference implementations that demonstrate best practices for handling large texture arrays in scientific contexts, and these resources circulate widely among developers building similar applications.
Patterns also show that educational resources play a role in broadening adoption, with university courses incorporating WebGPU modules for visualization classes and industry workshops providing hands-on sessions focused on scientific use cases. Those tracking GitHub activity find that repositories dedicated to tools like ParaView Web or similar frameworks have dedicated branches experimenting with WebGPU, while stable releases incorporate tested components gradually to maintain reliability for end users in research settings.
Future Directions Based on Emerging Data
Evidence suggests continued expansion as browser vendors refine WebGPU specifications and hardware vendors optimize drivers for web workloads, and this trajectory supports more ambitious projects involving machine learning-assisted visualizations. Developers in Asia-Pacific regions have begun contributing patches that enhance support for specialized scientific hardware, and these contributions diversify the ecosystem beyond initial Western-centric implementations. Data indicates that cross-platform consistency remains a priority, with ongoing work addressing edge cases in mobile and embedded environments where scientific tools increasingly appear.
Conclusion
Overall patterns demonstrate that WebGPU adoption among developers of interactive scientific visualization tools follows a measured yet consistent path driven by technical advantages in compute performance and direct hardware access. Continued monitoring of browser updates and community contributions will shape how these tools evolve, while geographic diversity in development efforts supports broader accessibility across different research infrastructures.